Quick Calc
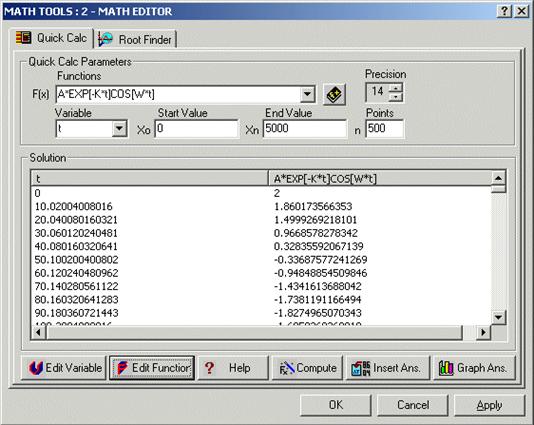
Quick Calc can be used to compute mathematical expressions over a specified range and for easily creating graphs of the results.
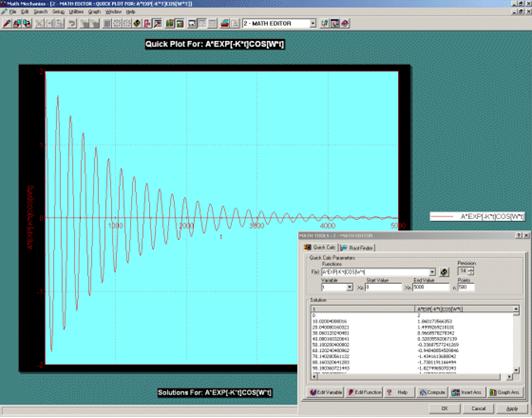
You can easily create a graph of your expression in Quick Calc by pressing the graph button, a graph of your expression over the specified interval will automatically be created.
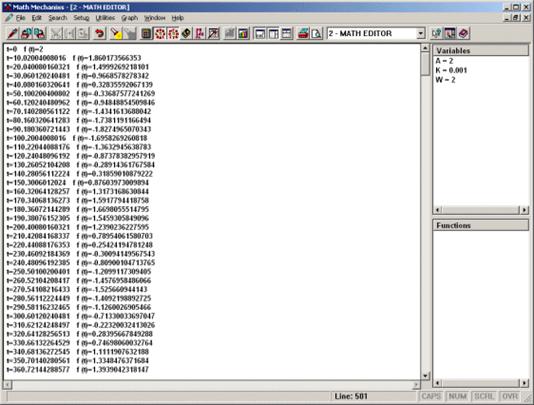
Also, with the click of a button you can copy your data directly into the Math Editor.
Root Finder
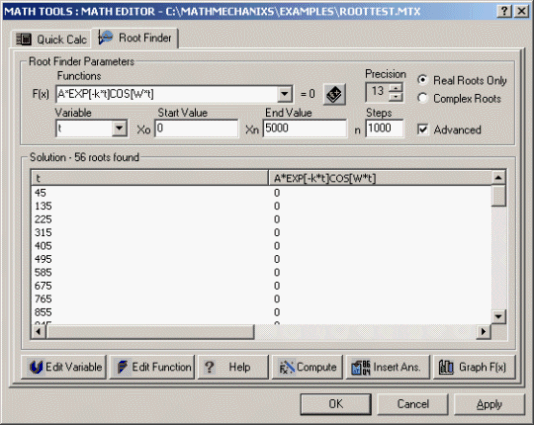
Root Finder can be used to quickly calculate the roots of mathematical expressions and polynomials.
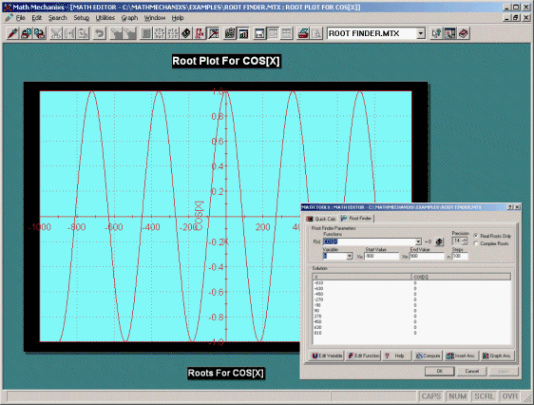
You will be able to quickly visualize your roots by pressing the graph button, creating a graph of your expression identifying the approximate locations of any roots over the specified interval.
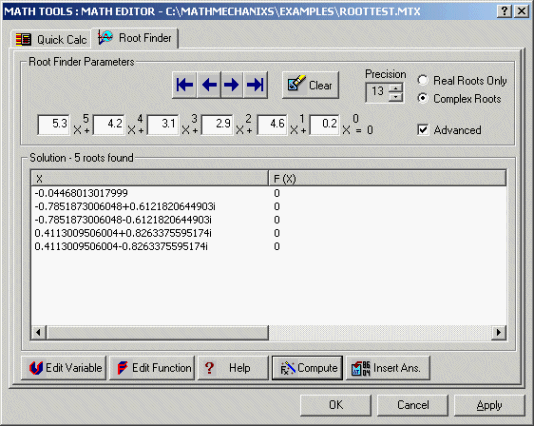
In addition, you can also find real and complex roots of polynomials with real or complex coefficients using the new polynomial root finding utility.
Curve Fitter
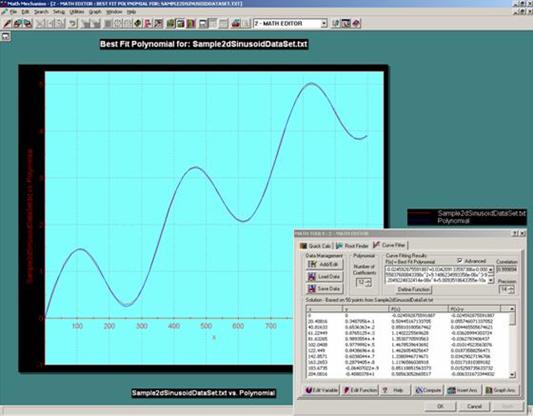
Curve Fitting can be used to perform linear and non-linear regression analysis/data modeling using an nth order polynomial.
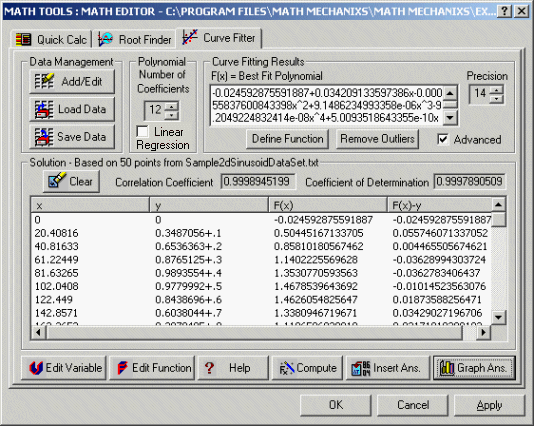
Comparing the best fit polynomial against the original data is a snap, just click the Graph Ans. button, that's it.
Matrices
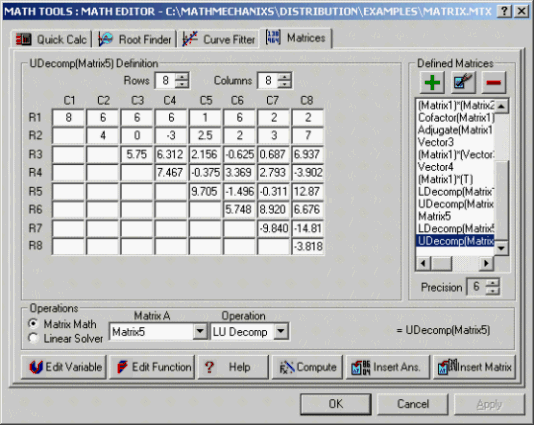
The Matrices Utility is part of the Math Mechanixs Math Tools and can be used to perform common matrix mathematics and linear equation solving. The new utility can be used to solve matrix problems with matrices as large as 10 x 10.
Matrix Math Operations:
- Addition
- Subtraction
- Multiplication
- Scalar Multiplication
- Inverse
- Transpose
- Cofactor
- Adjugate
- Trace
- Rank
- LU Decomposition
- Determinant
- Linear Equation Solving
Statistical Plotter 

The Statistical Plotting Utility (released with version 1.5.0.3) will allow you to easily build Histograms and Pareto Charts from manually enter data or from imported data loaded from ASCII Text or CSV files.
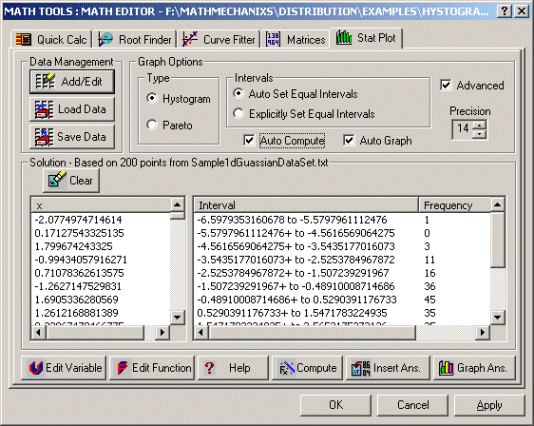
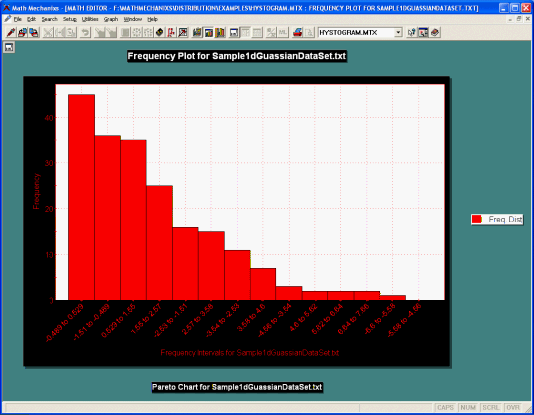
You can easily select from two chart types, histogram or pareto, plus you can either let Math Mechanixs compute the optimal frequency interval or you can explicitly set the number of frequency intervals to use in creating your plot. Below is an example of a histogram plot.
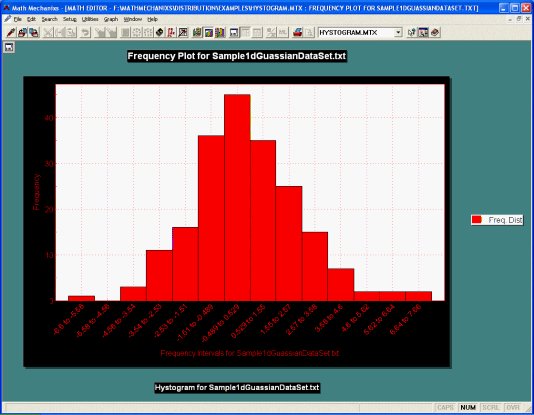
Also, as previously mentioned, by clicking the pareto button, you can quickly change your histogram to a pareto chart.
